Set monthly targets for leads, visits, contracts, and go-lives. See actuals vs targets at a glance. Understand your pipeline conversion rates and where your leads come from.
Set monthly targets for leads, visits, contracts, and go-lives. Charts show you exactly where you stand against your goals.
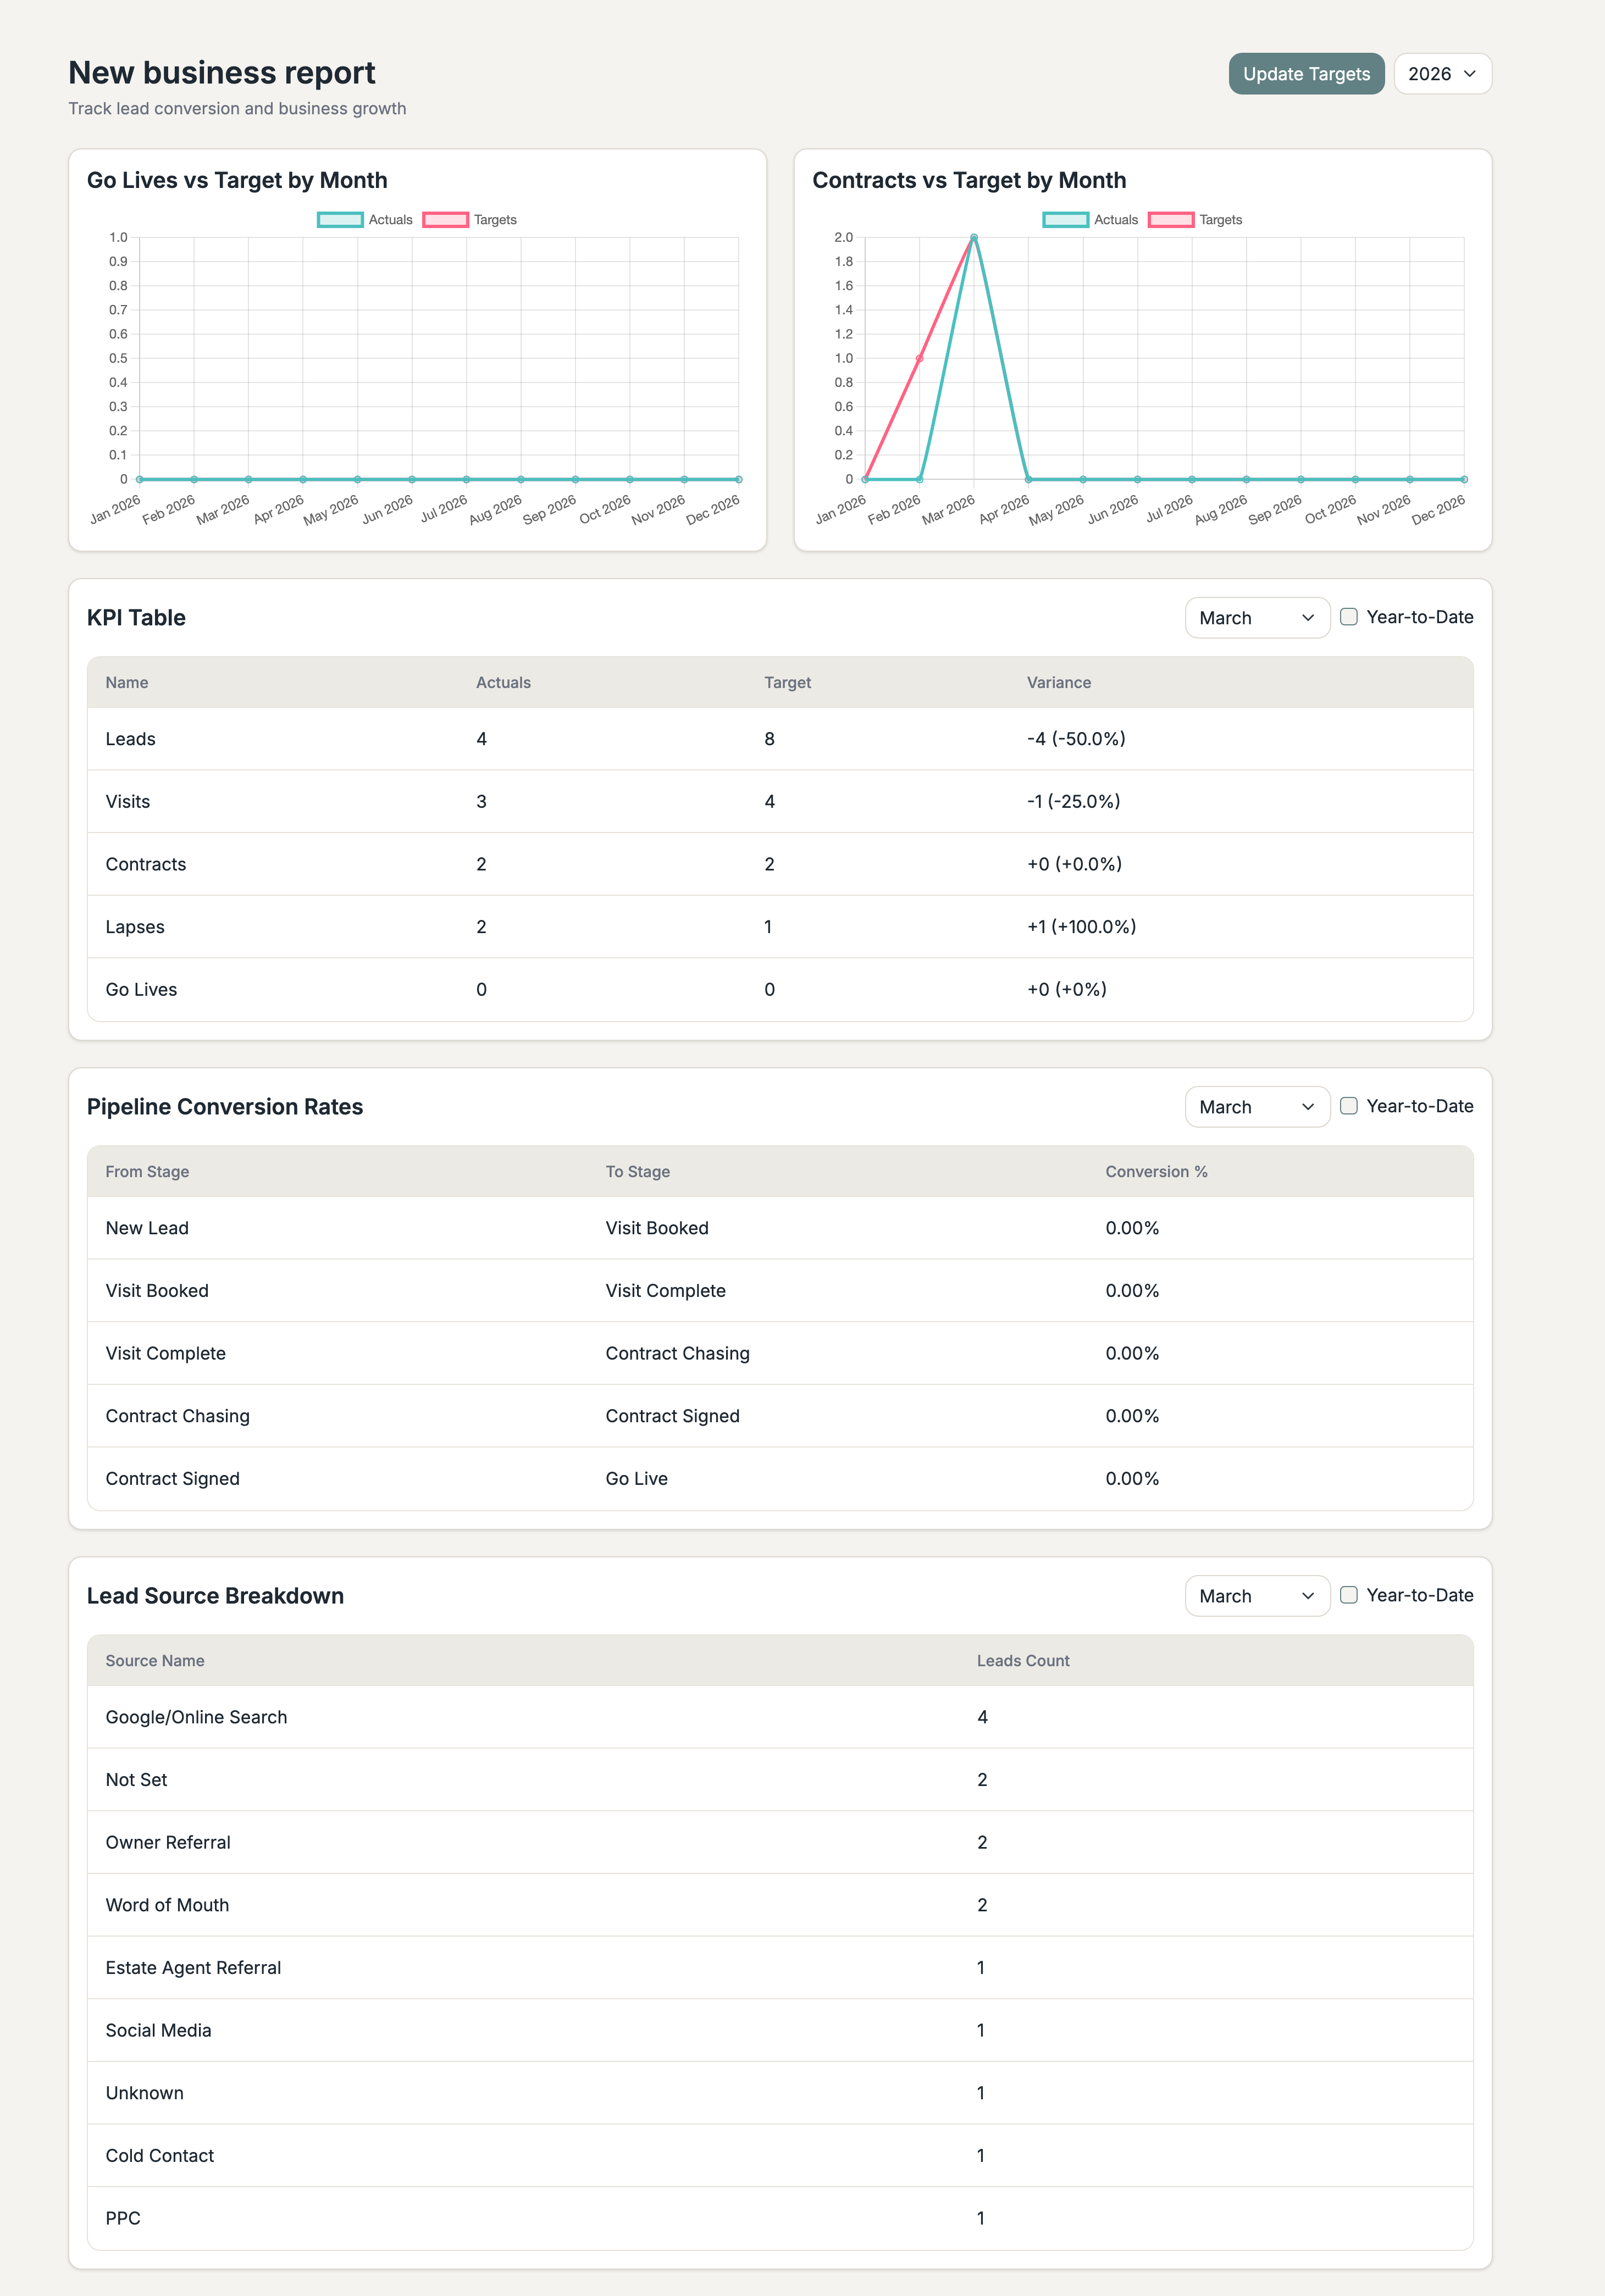
Leads, Visits, Contracts, Lapses, Go Lives. Actuals vs targets with variance, month by month.
See pipeline conversion rates by stage. Understand where leads drop off and what percentage make it through.
See which channels are bringing in leads: Google, referrals, estate agents, social media. Know where to invest.
Set targets, track performance, improve your process
Define monthly targets for leads, visits, contracts, and go-lives. Set them by month and year so you can plan ahead and track seasonality.
As you add leads, book visits, and sign contracts through the pipeline, the reporting data builds automatically. No manual entry needed.
Check your Go Lives vs Target and Contracts vs Target charts. Review the KPI table. Toggle year-to-date for the bigger picture. Adjust your targets as you learn.
The numbers that matter for growing your portfolio
See how many properties went live each month against your target. Understand whether you're growing at the pace you planned.
Track signed contracts against monthly goals. Spot shortfalls early and adjust your pipeline activity.
See what percentage of leads convert at each stage. Identify bottlenecks and focus your energy where it matters.
Understand which channels bring in leads and which ones convert. Stop spending on sources that don't deliver.
Leads, visits, contracts, lapses, and go-lives. Actuals vs targets with variance, month by month. Toggle year-to-date.
See why deals fall through. Unresponsive owners, commission concerns, letting confidence: 15 reasons tracked automatically.